ANALYTICS & REPORTING

Know that training works, not just
that it happened.

Completion rates tell you who finished. Lemonade's analytics tell you who learned, what they retained, and how it changed their performance.

Before LemonadeLXP — knowledge and at-risk metrics shown in red LemonadeLXP After LemonadeLXP — improved knowledge and at-risk metrics shown in purple
Before LemonadeLXP — knowledge and at-risk metrics shown in red After LemonadeLXP — improved knowledge and at-risk metrics shown in purple
MEASURING IMPACT

Beyond completion rates

Step-Level Baselines

Step-Level Baselines

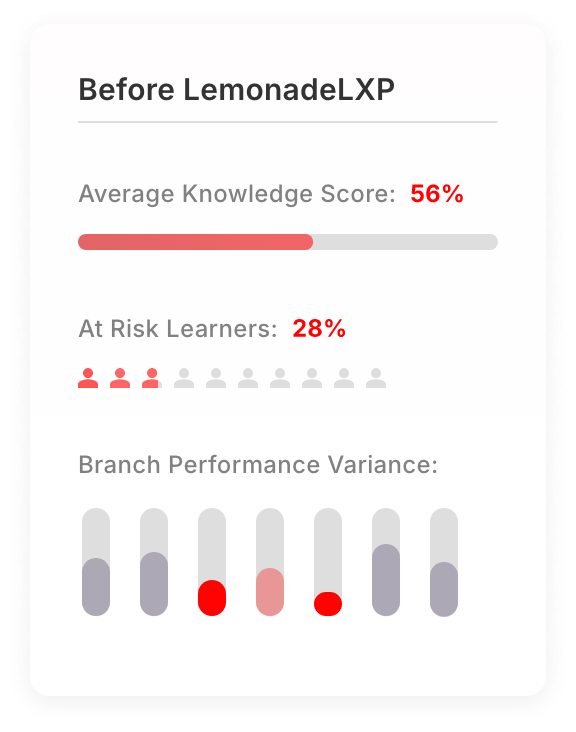
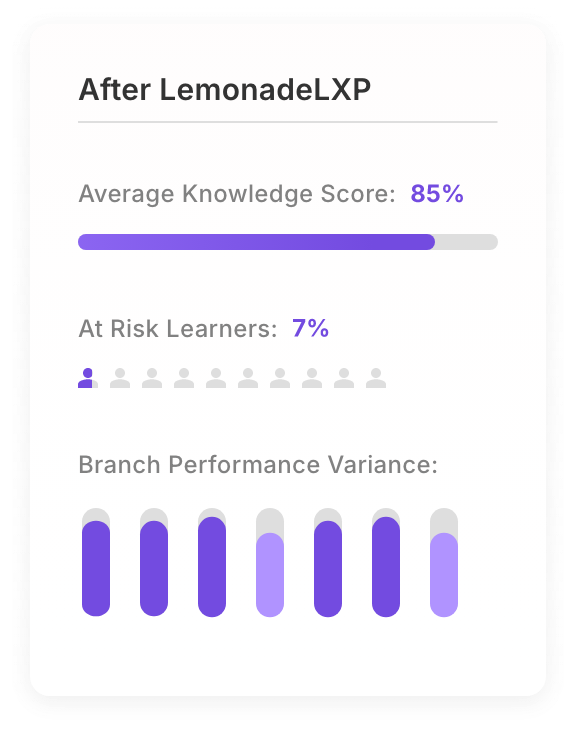
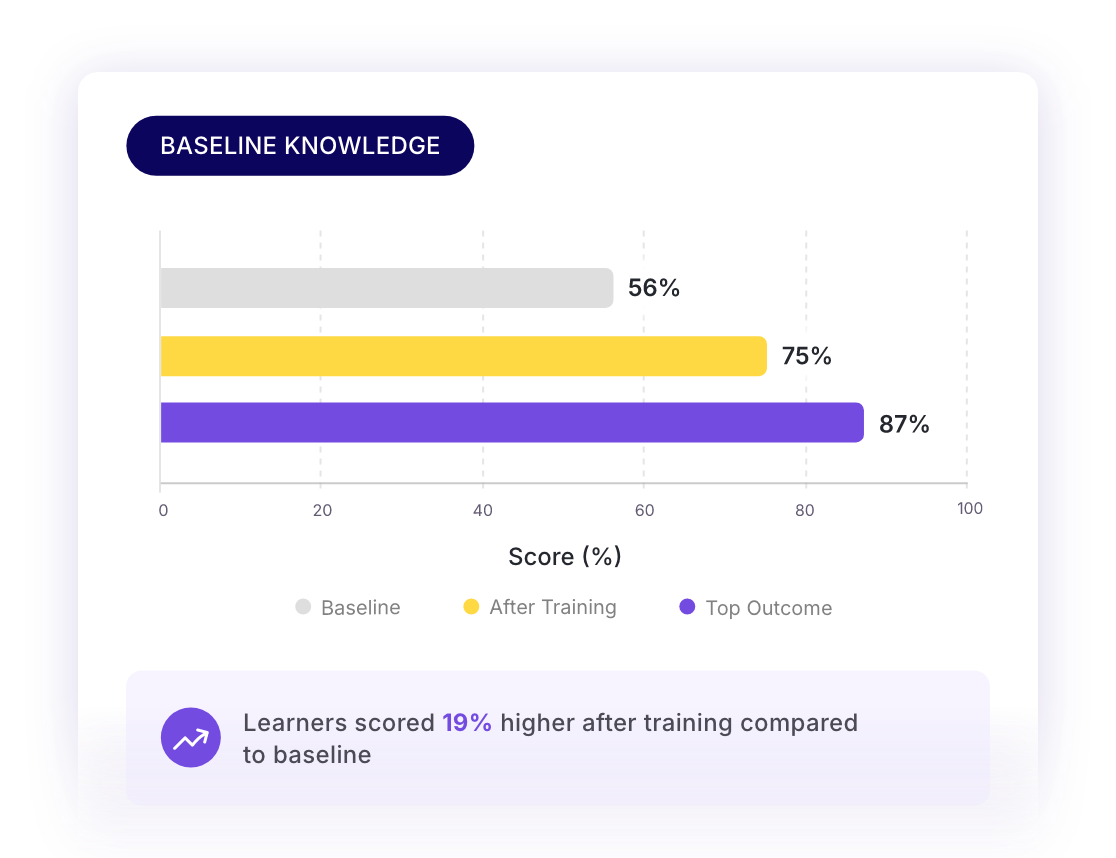
See how employees perform before and after training. Measure actual knowledge change.

Grade Distributions

Grade Distributions

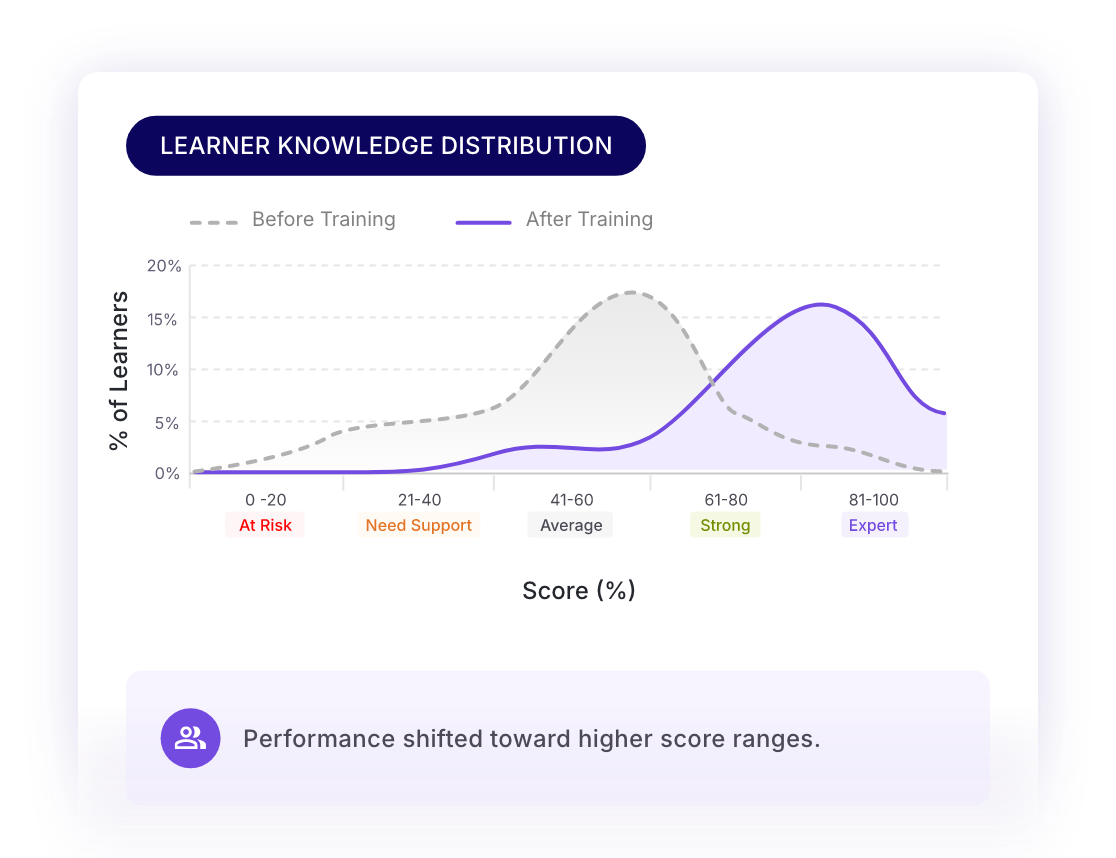
Understand the spread of knowledge across your team. Identify gaps before they become problems.

Trend Markers

Trend Markers

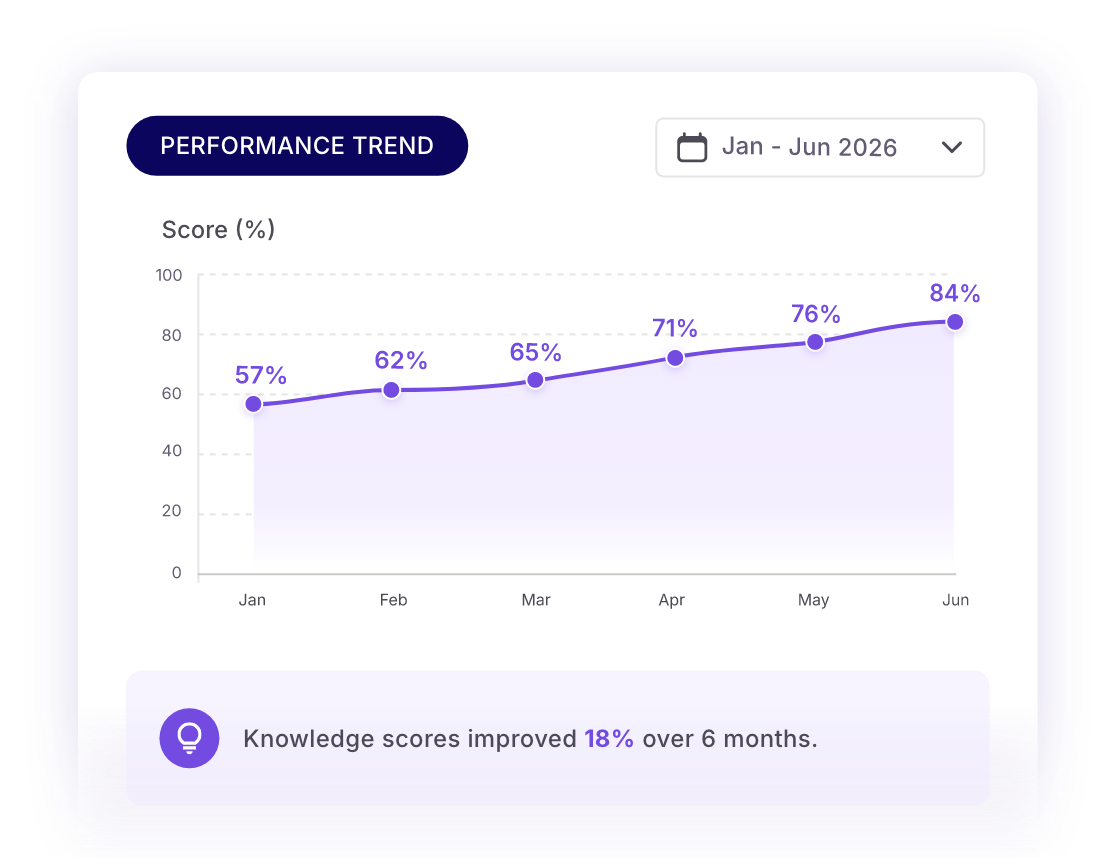
Track performance over time. Month-over-month improvement or decline, visualized.

Branch Comparison

Branch Comparison

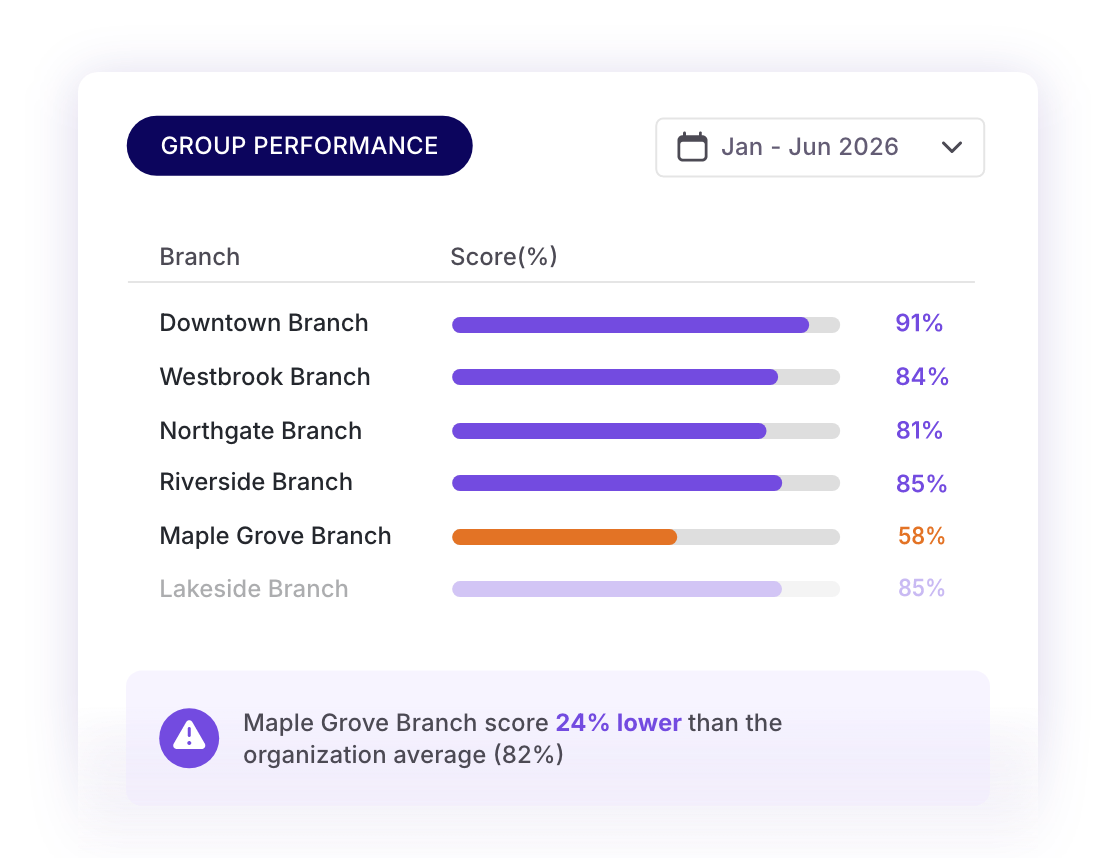
Compare performance across locations, departments, and roles. Spot inconsistencies.

CONNECT THE DOTS · SNOWFLAKE INTEGRATION

Pipe learning data into
your warehouse.

Sync LemonadeLXP knowledge, retention, and behavior signals directly to Snowflake. Join them with the proprietary data you already trust — sales, NPS, error rates, retention — and prove that training is moving the needle.

SOURCE

LemonadeLXP signals

  • Knowledge Score
  • 30-Day Retention
  • Training Completion
  • At-Risk Learners
Live sync enabled Automatically keeps learning data up to date in Snowflake.
  • LemonadeLXP
  • Snowflake-native
  • Your BI tools
NATIVE SYNC
  • SOC 2 Certified
  • Governed pipelines
  • Incremental syncs
YOUR WAREHOUSE

Business insights, unlocked

  • Revenue Impact Correlate learning performance with branch revenue.
  • Performance Impact Connect training activity to operational performance.
  • Customer Experience Correlate learning performance with customer NPS.

Joined Insights that drive results

+12.4%

Revenue lift in branches with knowledge scores above 80%.


KNOWLEDGE SCORE × REVENUE
−38%

Fewer compliance errors in teams with stronger training performance.


AT-RISK LEARNERS × ERROR RATE
+9 pts

Higher NPS scores in teams with stronger learning retention.


30-DAY RETENTION × NPS
2.7x

Faster onboarding in teams with higher training completion rates.


TRAINING COMPLETION × RAMP TIME
1 / 4

“Really cool to see month by month errors go down because they put in proper training.”

Name

See analytics in action.